Measure, Organize, Explain
Choose useful units and turn measurements into evidence.
Lesson objectives
By the end of this lesson, you should be able to:
- Choose suitable tools and units for measuring length, mass, liquid volume, time, and temperature.
- Read a ruler or measuring-cylinder scale and make simple metric conversions.
- Calculate the volume of a fully submerged, waterproof object from the change in water level.
- Organize measurements, calculate a simple mean, and support a conclusion with numerical evidence and a stated limitation.
One notebook says a bottle holds “500.” Another says “500 mL.” Which record can another class understand? A measurement needs a number and a unit.
The rise in water level reveals volume
Compare the readings in the same measuring cylinder, before and after gently adding a stone.
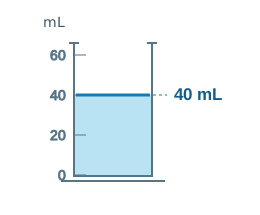
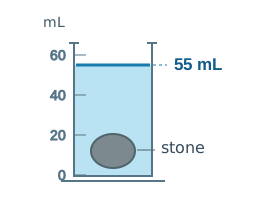
55 mLStarting reading
40 mLStone volume
15 mL
Read the diagram: 55 mL − 40 mL = 15 mL, which equals 15 cm³. Scale markings represent the example readings; the stone drawing is illustrative.
The object must be fully under the water and must not dissolve or absorb water. Avoid spills and trapped air. Read the bottom of the water meniscus at eye level; the waterline is drawn straight here to make the change easy to compare.
1. Match the tool to the quantity
| Quantity | Useful classroom units | Tool |
|---|---|---|
| Length | millimetre (mm), centimetre (cm), metre (m) | Ruler or tape measure |
| Mass | gram (g), kilogram (kg) | Balance or suitable scale |
| Liquid volume | millilitre (mL), litre (L) | Graduated cylinder or marked measuring jug |
| Time | second (s), minute (min) | Timer or stopwatch |
| Temperature | degree Celsius (°C) | Thermometer |
The International System of Units, or SI, helps people share measurements consistently. Its base units include metre for length, kilogram for mass, second for time, kelvin for thermodynamic temperature, and ampere for electric current. In class, Celsius is convenient for temperature. Litres and minutes are accepted for use with SI. Mass describes how much matter an object has; weight is a force due to gravity.
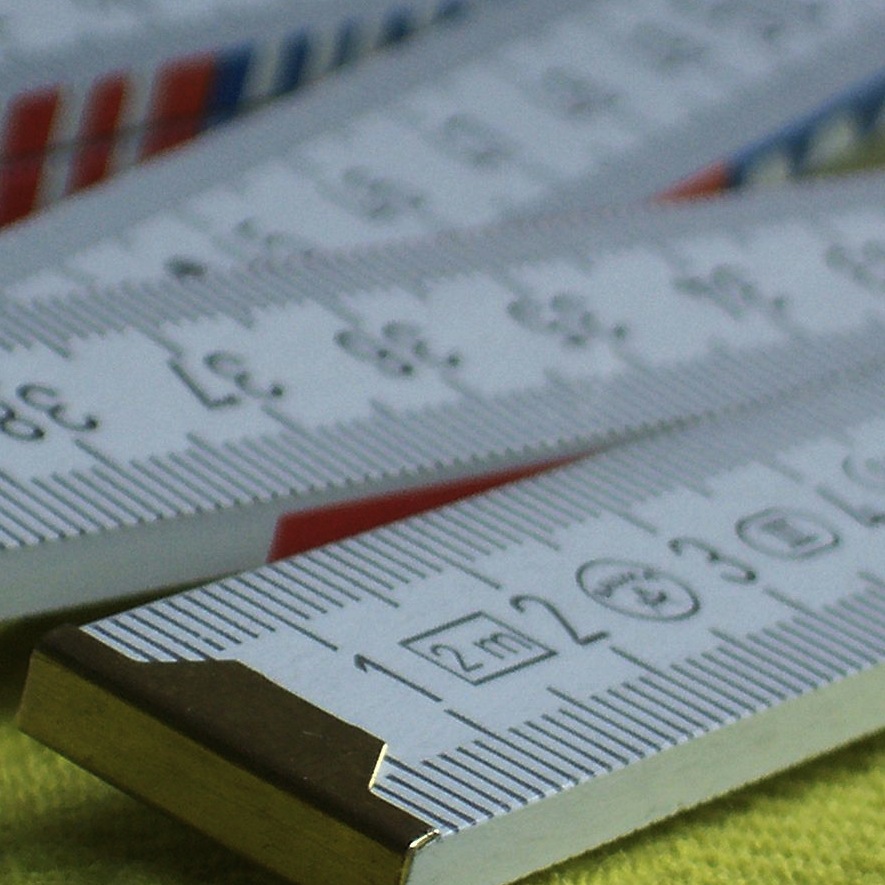
Photo: Goele · Wikimedia Commons · CC0 1.0. Displayed at reduced size.
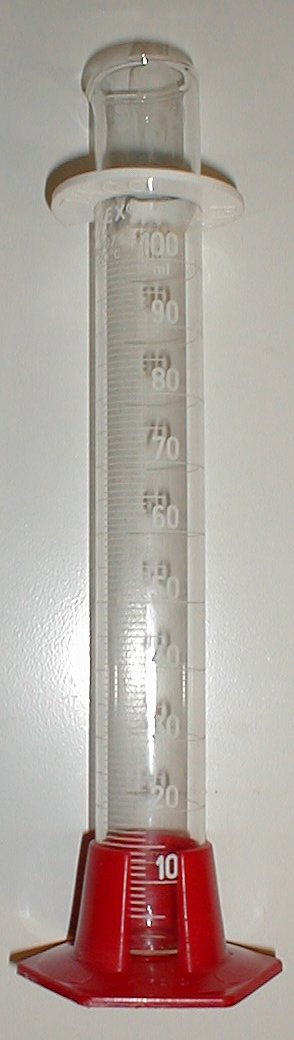
Photo: Darrien; uploaded to Commons by Haltopub · Wikimedia Commons · Public domain dedication. Displayed at reduced size.
2. Read a scale carefully
- Start a ruler at the zero mark, not necessarily the edge. If an object extends from 2 cm to 9 cm, its length is 9 − 2 = 7 cm.
- Check how much each small division represents before reading a tool.
- Set a graduated cylinder on a level surface. For water, read the bottom of the curved surface, called the meniscus, at eye level.
- Record the unit beside the number. Use only the precision your instrument can reasonably show.
1 cm = 10 mm · 1 m = 100 cm · 1 kg = 1,000 g · 1 L = 1,000 mL · 1 min = 60 s
Example: 2 L = 2,000 mL. A 300 mL sample is smaller than 1 L. Most metric conversions use powers of ten; minutes and seconds use 60.
3. Use water to find an irregular object's volume
A waterproof object that sinks and is completely submerged pushes aside water. If the cylinder reads 40 mL before and 55 mL after adding the object, its volume is 55 − 40 = 15 mL, equal to 15 cm³. Remove trapped air bubbles and avoid splashes. This method is unsuitable for objects that dissolve, soak up water, or remain partly above the surface.
Teacher-led activity: Use a plastic measuring cylinder and a clean, smooth, waterproof stone that fits without getting stuck. Record the starting level, gently lower the stone, and record the new level. Subtract. Keep water away from electrical equipment and wipe up spills. If tools are unavailable, practise with the example readings instead.
4. Make the pattern visible
A table keeps labels, units, and results together. A bar graph can compare categories such as cloth types. A line graph can help show a change over time. Always label the axes and include units.
| Cloth | Trial 1 (mL) | Trial 2 (mL) | Trial 3 (mL) |
|---|---|---|---|
| A | 12 | 11 | 13 |
| B | 7 | 8 | 6 |
Cloth A absorbed more in every recorded trial. Its mean is (12 + 11 + 13) ÷ 3 = 12 mL; cloth B's mean is 7 mL. These results support choosing A when absorption is the main goal under these conditions. They do not tell us which cloth costs less or lasts longer.
5. Explain using a claim and evidence
State what the results suggest, quote relevant measurements, and explain how they answer the question. Mention limits, such as a small number of trials. Share the method as well as the findings so others can check them.
Review at a glance
The big ideas
- Record every measurement with both a number and a unit.
- Choose the right tool, check its scale, and read it carefully.
- For a suitable submerged object, subtract the starting water level from the final level.
- Organize the results, look for patterns, and support your conclusion with numbers and a limitation.
Key terms & meanings
- SI
- The International System of Units: a shared system for expressing measurements.
- Unit
- A standard amount used to express a measurement, such as a metre or a second.
- Length
- The distance between two points; often measured in mm, cm, or m.
- Mass
- How much matter an object has; commonly measured in g or kg.
- Weight
- The force of gravity on an object. It is different from mass.
- Volume
- The amount of space something occupies; liquid volume is often measured in mL or L.
- Time
- How long an event lasts; measured with units such as seconds or minutes.
- Temperature
- A measure of how hot or cold something is; classroom thermometers often use °C.
- Meniscus
- The curved surface of a liquid. For water in a cylinder, read the bottom at eye level.
- Water displacement
- The water pushed aside by an object; a fully submerged suitable object displaces its own volume.
- Mean
- An average found by adding the values and dividing by how many values there are.
- Results table
- A labelled arrangement of observations or measurements in rows and columns.
- Bar graph
- A graph that uses bars to compare amounts across categories.
- Line graph
- A graph that connects data points to show a pattern, often a change over time.
- Limitation
- A condition that restricts what can be concluded, such as testing only a few samples.
- Object volume = final water reading − starting water reading
- Mean = sum of the values ÷ number of values
- 1 cm = 10 mm · 1 m = 100 cm
- 1 kg = 1,000 g · 1 L = 1,000 mL
- 1 mL = 1 cm³ · 1 min = 60 s
Study tip: Cover the meanings, explain each term in your own words, then check your explanation.